For a
brighter
tomorrow
brighter
tomorrow
2022 Annual Review
Click to watch
01
Executive Chair’s Letter
01Executive Chair’s Letter
Executive Chair’s Letter
Ana Botín
01
SCROLL DOWN
02
Chief Executive Officer’s Letter
02Chief Executive Officer’s Letter
Chief Executive Officer’s Letter
José Antonio Álvarez
02
SCROLL DOWN
03
Santander in 2022
03Santander in 2022
Santander in 2022
Santander Today
2022 Results
03
SCROLL DOWN
04
Santander tomorrow
04Santander tomorrow
Santander tomorrow
Strategy and targets
04
SCROLL DOWN
05
DataHub
05DataHub
DataHub
05
SCROLL DOWN
01. Executive Chair’s Letter:
- Executive Chair’s Letter
- Chief Executive Officer’s Letter
- Santander in 2022
- Santander tomorrow
- DataHub
Executive Chair’s Letter
- Dear shareholder
- Key achievements and review of 2022
- Delivering on our 2019-2022 strategic plan
- Looking ahead, our medium-term plan
- Conclusion
Dear shareholders,
In 2022 Santander delivered record profitability while further expanding its commercial reach and strengthening its balance sheet and capital levels. Not only did we achieve our targets for the year, but we also met the medium-term targets we set in 2019.
This achievement is all the more remarkable because 2022 was, by any standard, an extraordinary year. A year in which we saw the emergence of a new world, geopolitically more complex and economically more volatile and uncertain.
Back in December 2021, as the shock of the pandemic receded, economists expected inflation to be transitory, Europe to grow faster than the US, and Chinese GDP to rise above 5%. None of that has happened.
Instead, Russia’s invasion of Ukraine sparked Europe’s worst energy crisis since the 1970s. Inflation, reinforced by war, disruption of supply chains, and the continued impact of climate change, became the world's biggest macroeconomic concerns. And as though these were not enough, the zero-Covid policy imposed by the Chinese authorities dampened the growth of China’s - and the global - economy.
Many believe that this new world will inevitably be worse than the one we left behind. That the long period of improving living conditions, reducing poverty, better education, technological progress, and the spread of democracy has come to a halt. Some worry that it may not return.
However, this is not my vision of the world.
I have long defined myself as an ‘’optimist who worries a lot’’. Someone who believes in humanity's capacity, based on its innate desire for progress, reason, and to use science, technology evidence and based policies to deal with the challenges ahead.
While I don’t believe that everything will always get better, I am convinced that solutions can always be found to the problems we face.
As has happened so many times before, it is the decisions made by entrepreneurs, innovators, and those who are willing to stake their reputation, their money and their time in search of solutions that will move us forward.
Looking ahead, that spirit of enterprise is greater than ever. The consensus view is that global growth will decelerate below 3% this year and will hover around 1% in the most developed economies. Inflation, while declining, is likely to average 4-6% in 2023; and Europe and the US will continue to have interest rates below or close to headline inflation.
In our core geographies, with close to full employment in two-thirds of our markets, we expect declining inflation, low unemployment, and sustained economic growth, albeit moderate.
Listen to the letter
00:00
All in all, the crucial question for the global economy in 2023 is simple: How can the world’s economies return to sustainable growth per capita with the right distribution among all parts of society amidst a storm of rising prices and higher interest rates?
The answer is that governments and the private sector must act together to lay the foundations for a new phase of progress, sustainable growth, and global prosperity.
There will be no prosperity without growth, and there can be no growth without confidence, investment, innovation, and a policy framework designed to support productivity improvements, efficient resource allocation, and profitability. These are the conditions that ensure prosperity will reach all layers of the population.
Leading financial institutions, like Santander are a key part of the future – part of the solution, not the problem. Banks maintain the flow of credit and investment that stimulates sustainable growth, which in turn creates jobs. And, as our results show, we fulfill this mission while delivering value for our shareholders.
I am optimistic not only about the future of Santander itself, but the role we can play to support growth in Spain, and in all the markets in which we operate across Europe and the Americas.
“There will be no prosperity without growth, and there can be no growth without confidence, investment, innovation, and a policy framework designed to support productivity improvements, efficient resource allocation, and profitability”
2022: Key achievements
Despite the difficulties and turbulence of 2022, we remained focused on our aim to become the best open financial services platform, by acting responsibly to earn the lasting loyalty of our people, customers, shareholders, and communities – in other words, all of our stakeholders. We continue to live our purpose of helping people and businesses prosper, while aspiring to make everything we do Simple, Personal, and Fair.
During the year, we increased our customer base by 7 million. This helped support the growth in volumes and revenue, supported by the impact of the new interest rate environment.
This enabled us to achieve and maintain the upward trend in profitability as demonstrated by our Return on Tangible Equity, which increased to 13.4%, from 12.0% (statutory) in 2021. This was driven by record profits of €9.6 billion which, coupled with the reduction of shares through buybacks in 2022, resulted in earnings per share growth of 23%.
This enabled us to achieve and maintain the upward trend in profitability as demonstrated by our Return on Tangible Equity, which increased to 13.4%, from 12.0% (statutory) in 2021. This was driven by record profits of €9.6 billion which, coupled with the reduction of shares through buybacks in 2022, resulted in earnings per share growth of 23%.
Underlying attibutable profit evolution (€bn)
Underlying RoTE evolution
Customer base growth
+
0
7
mn
Underlying RoTE
0.0
13.4
%
Attributable profit
€
0.0
9.6
bn
Earnings per share growth
+
0
23
%
Importantly, thanks to the hard work of our teams, these results have been delivered while we have continued to transform our business model. Better operational performance improved our cost to income ratio from 46.2% to 45.8%. We also focused on leveraging our Group’s scale: as an example, our global Santander Corporate and Investment (SCIB) business accounted for 14% of the Group revenues, of which 47% (€3.4 billion, up 33% year over year) would not have been realized without our global reach.
We maintained a low risk profile characterized by a conservative risk appetite, strong risk management capabilities, and stable and predictable credit exposures. The Group cost of risk remained in line with our 2022 guidance of 100 basis points, despite the growth in provisions, which mainly reflect macroeconomic factors and individual provisions in Brazil.
We have also strengthened our balance sheet and capital position year after year, including during COVID-19. In 2022, we generated 138 basis points of organic capital of which 45% (62 basis points) were paid out as shareholder remuneration; overall, we reported a CET1 of 12.04%, which is above our target. We have continued to be disciplined in our capital allocation, reaching our objective of having 80% of our Risk Weighted Assets yield a Return on Equity above the Cost of Equity, compared with 70% in 2021.
CET1 evolution
Strengthening our capital every year
1. Including the acquisition of SCUSA minority interest which closed on 31 January 2022, and the acquisition of Amherst Pierpont
Cost to income ratio
0.0
45.8
%
Cost of Risk
<
0
1
%
CET1 fully loaded
0.00
12.04
%
We maintained our policy of allocating half of our shareholder remuneration to share buybacks. At our current valuation levels, share buybacks are one of the most effective ways to generate shareholder value while preserving the capacity to invest in our business. Total shareholder remuneration in 2022 will amount to €3.8 billion, of which €1.9 billion is being distributed via buybacks and €1.9 billion being paid in cash dividends. The cash dividend per share will have increased by 18% over the previous year.
After January’s buyback, we bought back 5% of our outstanding shares since 2021. We delivered 6% growth in shareholder value creation (growth in the sum of tangible book value per share and dividend per share). Share buybacks at current prices remain accretive to tangible book value per share, a sharp contrast to historical remuneration policies based on scrip dividends, which were neutral for shareholders (the same value was divided among a larger number of shares).
After January’s buyback, we bought back 5% of our outstanding shares since 2021. We delivered 6% growth in shareholder value creation (growth in the sum of tangible book value per share and dividend per share). Share buybacks at current prices remain accretive to tangible book value per share, a sharp contrast to historical remuneration policies based on scrip dividends, which were neutral for shareholders (the same value was divided among a larger number of shares).
Shareholder remuneration (€bn)
Fiscal year total shareholder remuneration: cash dividend + share buybacks, not including scrip dividends. 2022 final cash dividend subject to shareholder approval.
Shareholder remuneration
Meanwhile, we continue our approach of embedding responsible banking into the heart of Santander. Our clear ESG strategy, backed by robust governance, has helped us to use the power of our business to address major global challenges, delivering profit with purpose. Three areas merit highlighting.
First, we continue to support our customers in their transition to a green economy as we advance towards our aim of the Group generating net zero carbon by 2050. Our position as a global leader in renewable energy financing is an opportunity in a vast growth market worth almost half a trillion USD. In addition, we set three new interim targets to decarbonize our portfolios in the energy, steel, and aviation sectors.
First, we continue to support our customers in their transition to a green economy as we advance towards our aim of the Group generating net zero carbon by 2050. Our position as a global leader in renewable energy financing is an opportunity in a vast growth market worth almost half a trillion USD. In addition, we set three new interim targets to decarbonize our portfolios in the energy, steel, and aviation sectors.
Second, financial inclusion is another big opportunity: in Latam, where we have an extensive footprint on all major economies, more than a 100 million people still do not have a bank account. We are working to change that. In the years 2019-2022, we have financially empowered 11.8 million people – 3 years ahead of our 10 million target. Last year, we won Euromoney's Best Bank for Financial Inclusion award for the second year in a row; and we received similar recognition from The Banker.
Third, we continue to build on Santander’s success in supporting education, employment, and entrepreneurship. In 2022 Santander Universities awarded more than 266,000 scholarships and grants to students, professionals, entrepreneurs and SMEs; and allocated €100 million through partnerships with more than 1,300 universities.
Our contribution to the economies of the countries we operate also comes in the form of taxes. In 2022, our corporate tax amounted to €5.5 billion. In addition, we paid €4.2 billion in other taxes1 and channeled €10.7 billion of our customers and providers taxes.
1. Other Taxes: Non-recoverable value added tax, sales tax, employer-paid payroll tax, property tax, bank levies and other.
All our progress depends on our ability to attract and develop the right leaders and teams, and a culture of teamwork, transparency, and customer focus which we have fostered over many years. The results of our efforts are reflected both internally and externally. Santander employees are highly engaged, with a global eNPS (employee Net Promoter Score) of 54, in the top 10% of the Finance sector and 16 above the All Companies index. We have also made significant progress towards our 2025 Diversity, Equity and Inclusion (DE&I) commitments: for example, 29% of senior positions are now held by women, close to our 2025 target of 30%.
We continued to attract new talent to the Group, having grown in 2022 our total workforce by close to 8 thousand employees, a 4% year over year increase. We did not reduce the size of our teams in any of our markets.
We continued to attract new talent to the Group, having grown in 2022 our total workforce by close to 8 thousand employees, a 4% year over year increase. We did not reduce the size of our teams in any of our markets.
Financial inclusion
0.0
11.8
mn
People financially empowered
Awards and recognitions
Bank of the Year for
Financial inclusion
Financial inclusion
World's Best bank for
Financial inclusion
Financial inclusion
Santander Universities
>
0
266
k
Scholarships
and grants
and grants
€
0
100
mn
through partnerships with >1,300 universities
Where our profit comes
from and where it goes to
from and where it goes to
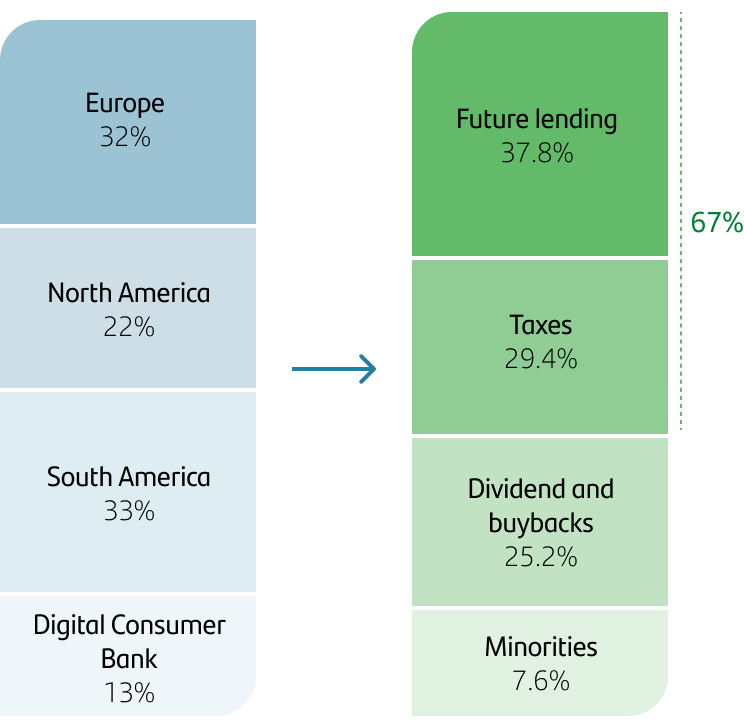
Profit before tax 2022
Delivering on our 2019-2022 strategic plan
Our success in 2022 marked the culmination of four years of delivering on our strategic plan – which is even more remarkable as this period included the Covid-19 pandemic. This shows the strengths of our business model – our customer focus, scale, diversification – and the progress we continue to make in our business transformation, while maintaining a disciplined approach to capital allocation.
ID 2019 Targets
2022
Loyal customers (mn)
0
26
0
27
Digital customers (mn)
0
50
0
51
% Digital sales over total
>
0
50
%
0
55
%
Efficiency ratio
0
42
%-45%
0.0
45.8
%
CET1 fully loaded
0
11
%-12%
0.00
12.04
%
RoTE
0
13
%-15%
0.0
13.4
%
Payout
0
40
%-50%
c.
0
40
%
Note: Subject to approval of the final dividend at the 2023 AGM and completion of the Second 2022 Buyback Programme, for which we have just got the approval of the ECB.
Customer focus
We have increased our number of customers to 160 million, of whom 27 million are loyal. When we acquire one customer, we benefit from our strong network effect. Through our unique combination of brand, branches, people, and products, we can offer an average of 2 to 3 additional products. This helped us to be Top 3 in NPS in 8 markets.
Scale
That success has been powered by our unique combination of both in-market and global scale.
Our competitive advantage globally stems from the virtuous circle of mutually re-enforcing value creation of our in-market scale and global scale. Today, we have two businesses that are globally run and managed: Santander Corporate & Investment Banking (SCIB) and Wealth Management & Insurance (WM&I). We also have two global networks: PagoNxt, which works closely with our geographies and businesses already; and Auto1, which we aim to run as global business in the future. Together, in 2022, these global and network businesses represented more than 30% of our total Group revenues and more than 50% of our profit.
Our competitive advantage globally stems from the virtuous circle of mutually re-enforcing value creation of our in-market scale and global scale. Today, we have two businesses that are globally run and managed: Santander Corporate & Investment Banking (SCIB) and Wealth Management & Insurance (WM&I). We also have two global networks: PagoNxt, which works closely with our geographies and businesses already; and Auto1, which we aim to run as global business in the future. Together, in 2022, these global and network businesses represented more than 30% of our total Group revenues and more than 50% of our profit.
1. Auto Includes: Auto business in DCB, SCUSA SBNA and Auto portfolios in Mexico and Brazil.
In SCIB, our global presence enabled us to generate €7.4 billion in total revenues (14% of the Group) in 2022. We are able to provide a “one-stop shop” service to our customers across geographies capturing cross-border flows; and we can offer SCIB products and services to our consumer and commercial customers across the Group. Our global centers of expertise allow us to deliver both transactional network banking and investment banking products and services to our customers across geographies.
We are global leaders in Project Finance, Infrastructure, Energy transition and Export and Agency Finance. This also allows us to optimize the Group’s returns through asset rotation / distribution.
We are global leaders in Project Finance, Infrastructure, Energy transition and Export and Agency Finance. This also allows us to optimize the Group’s returns through asset rotation / distribution.
SCIB revenues
0
14
%
Contribution to
Group's revenue
Group's revenue
In WM&I, our competitive advantage comes from our global platforms. In private banking, we provide global services to customers that purely local banks cannot provide. In 2022, €51 billion assets under management (AuM) (21% of PB total AuM) were due to our global network, driving profitability of 0.39% PBT/AuM, double that of our peers. In asset management, we centrally manage c.60% of the European countries AuM. This gives us a cost advantage in the fund management business, where our cost to income ratio is 49%, lower than peers’ average of 57%.
In Insurance, we manage our regional joint ventures with the scale that 21 million customers bring, delivering a combined ratio of 70% versus 90% for our competitors.
In Insurance, we manage our regional joint ventures with the scale that 21 million customers bring, delivering a combined ratio of 70% versus 90% for our competitors.
Private Banking
€
0
51
bn
AuMs due to global network
In Auto, we are the number one player in Europe and Latam, and number 5 in the US. Our strong relationships with original equipment manufacturers (OEMs) in Europe has allowed us to build the leading automobile financing business in Latam, and to support growth of our business in the US. Today, more than 40% of the overall activity financed in these countries is related to our partner OEMs relationships in Europe. This business would not be available to a local Auto finance company without global / regional relationships.
Auto
0
40
%
of activity from OEMs
relationship in Europe
relationship in Europe
In payments, during 2022 PagoNxt grew revenues by 72% (constant euros). Getnet, its merchant acquiring business, ranked top 3 in Latam in 2022, grew revenues by 49% year on year. Mexico is the first market where we have completely rolled out our modern cloud native and API-first platform and completed the migration away from a third-party provider. As a result, payment volumes grew at 35% to become the second largest acquirer in Mexico with an 18% market share. In addition, Ebury grew revenues by 76% and was profitable as of December 2022.
PagoNxt
0
72
%
revenue growth
Our cards business contributed 10% to Group´s profits in 2022 with a RoRWA four times higher than that of the Group: we now manage 97 million cards, and in 2022 we continued to grow at double-digit, 19% in revenues and 14% in turnover.
Cards
0
97
mn
Last, our global approach to harnessing the power of our network is supported by our technology capabilities. As we deploy new platforms across the Group, our local banks will avoid the need to duplicate investments, hence reducing costs. Examples include the deployment of common global cybersecurity capabilities, which have strengthened our cybersecurity while driving an estimated €210 million in efficiencies in 2022; and the successful implementation of a global platform in SCIB, which enables the business to maintain a cost to income of 39%, one of the best in the industry.
All in all, these global network capabilities are contributing c.€10 billion to Group revenues that would not exist otherwise.
All in all, these global network capabilities are contributing c.€10 billion to Group revenues that would not exist otherwise.
Diversification
Our diversification has long helped us strengthen our balance sheet. This has proved to be a key competitive advantage during the 2008 financial crisis, the 2011 sovereign debt crisis and the impact of the Covid-19 pandemic. It explains why Santander has consistently performed among the best banks in Europe in ECB stress tests, and clearly better than the European system average.
EBA ST from 2014 to 2021 excercises
CET1 fully loaded impact adverse (bps)
Source: Banks’ financial reporting, EBA Stress Tests.
Our diversification has also enabled us to lower the risk profile of the Group and to maintain higher profitability in times of crisis. This means Santander offers a better risk-return proposition than our peers. Our pre-provision profitability is not only stable, but also higher than that of our competitors, which provides us with a strong loss absorption capacity. Additionally, we have a high level of loan reserves on our balance sheet for the credit risk that we carry.
Resilient profit generation throughtout the cycle
Group pre-provision profit (€bn)
When we combine our capital level with loan loss reserves and pre-provision profits - the so-called three lines of defence - we rank above the average of our main peers in Europe. We believe this is a better indicator of “capital at risk” than just the capital ratio alone.
2Q’22 Capital - Lines of defence
Santander
Euro avg.
Spanish avg.
1
CET1 fully loaded
CET1 /RWAs
0
12
%
0
13
%
0
12
%
2
Low risk model
(Allowances - NPLs) / RWAs
-
0.0
1.5
%
-
0.0
1.2
%
-
0.0
1.7
%
3
Strong & recurrent profit
PPP/RWAs
0.0
4.5
%
0.0
2.8
%
0.0
3.3
%
CET1 + Lines of defence
1 + 2 + 3
0
15
%
0
15
%
0
14
%
Source: EBA transparency exercise Jun 22. Fully Loaded ratios. European banks: ING, ISP, Commerzbank, Nordea, SocGen, BNP, Deutsche, Credit Agricole, BBVA and Unicredit. Spanish banks: Santander, Sabadell, CaixaBank, BBVA.
Our rock-solid balance sheet puts us in a strong position to deal with the current uncertain environment. We have low, predictable, and diversified credit risk and a proven approach to risk management. Our balance sheet is simple and transparent, with customer loans representing 56% of our total assets while the average of our peers is 30%. As a result, even our most cyclical portfolios have delivered positive risk-adjusted spreads over the cycle. Our loan exposures are highly collateralized, with 65% being secured and 80% of our loan book originated within mature markets.
In our one trillion-euro loan book, there are only two medium-high risk portfolios - Brazil and the US consumer finance business – which represent 4% of our book and account for a quarter of our total provisions. Both have delivered superior profitability in the last years.
In Brazil we have delivered a gross income after cost of credit margin of between 10% and 15% through the cycle. The CoR has also been steadily decreasing since 2013.
Our US auto consumer finance business has delivered very solid risk adjusted margins of 5% or higher since 2018. Over the past three years, we have significantly de-risked our US auto portfolio. We began to gradually utilize deposits to finance prime loans in 2018. As a result this portfolio, which was originally focused on subprime, has increased its prime component from 21% of loans in 2018 to 41% in 2022. Thanks to the higher credit quality of retained loans, the CoR has steadily decreased from high single-digit in 2018 to low single-digit today.
Coupled with a low-risk business profile, we follow a very conservative management of structural risks: liquidity, interest rate risk and currency risk. We amply exceed all regulatory requirements in these areas. Our loans are 83% funded by high-quality retail deposits.
Capital allocation
We have been disciplined in our investments, divestments, and capital management. Back in 2015, only 40% of our portfolios earned their cost of capital; in 2019, that figure was 70%; today we have increased it to 80%, in line with our 2022 target.
Since 2015 we have divested assets valued at €10.8 billion. Excluding Banco Popular, we invested €5.8 billion in new business, and bought back minority interests valued at €5.6 billion, which was conducted at very attractive levels, creating value for shareholders above our cost of capital.
Since 2015 we have divested assets valued at €10.8 billion. Excluding Banco Popular, we invested €5.8 billion in new business, and bought back minority interests valued at €5.6 billion, which was conducted at very attractive levels, creating value for shareholders above our cost of capital.
Looking ahead: a new phase of profitability and growth by building a digital bank with branches powered by the Santander network
The proven success of our business model gives us a strong foundation upon which we can build the best open financial services platform and set new ambitions, which we unveiled at our Investor Day 2023.
We aspire to have the best in-market profitability in each of the markets in which we operate. We will do this by further automating all our businesses, with a focus on consumer and commercial customers, where we have the greatest opportunity; and by ensuring our global and network businesses work even more closely with our local banks, which will reinforce each other’s growth.
The transformation of our business and operating model will enter a new phase, as we build a digital bank with branches powered by the Santander network.
The transformation of our business and operating model will enter a new phase, as we build a digital bank with branches powered by the Santander network.
Customer centric
Net new customers (total, active1)
Simplification &
automation
automation
Cost per customer
and efficiency ratio
and efficiency ratio
Network
contribution
Higher revenues and
lower costs
contribution
Higher revenues and
lower costs
Network revenue
Customer activity
Transactions volume growth
Capital
RWA with
RoRWA > CoE
RoRWA > CoE
Value
creation
creation
RoTE, TNAVps + DPS
Digital Bank
with Branches
with Branches
1. Those customers who meet transactionality threshold in the past 90 days.
This concept reflects the fact that people who bank with us are not – as in the case of many digital businesses – simply “users”. They are customers - people who are trusting us with their money; who want a service that is simple, personal and fair; and who want a high quality omni-channel experience.
The expansion of our customer base in recent years shows that we are growing in the right way, and we have set ambitious targets to add c.40 million more customers in the coming three years, including c.26 million active customers. We track both total and active customers as individuals and businesses, who often come to us for a single product with limited transactions, then deepen the relationship over time as we show the value we can add. By tracking both total and active customers we can ensure we can truly deliver value.
To meet the needs and expectations of our customers, we will continue to simplify our product offering, and will fully automate our front and back-end operations. This will help to deliver a lower cost to serve and allow us to offer the best customer experience. Our branch colleagues will be able to spend more time on giving our customers the personal service they want, especially as they make the most important financial decisions, across all channels.
To meet the needs and expectations of our customers, we will continue to simplify our product offering, and will fully automate our front and back-end operations. This will help to deliver a lower cost to serve and allow us to offer the best customer experience. Our branch colleagues will be able to spend more time on giving our customers the personal service they want, especially as they make the most important financial decisions, across all channels.
Total customers by 2025
c.
0
200
mn
Total active customers by 2025
c.
0
125
mn
To achieve this goal, we are bringing consumer and commercial customers onto a common operating and business model. This model is based on proven operating models such as the one in Santander Portugal, where we have freed up branch employees from operational activities and with the help of modern, proprietary technology assets within the Group.
For example, Openbank already serves more than two million customers through our digital bank in Spain, Germany, The Netherlands, Portugal and Argentina. The front-end (what the customer sees and uses) is our proprietary cloud-based platform. It is more efficient, with a higher level of automation that drives lower operating cost with an average of approximately 50 operational FTEs per 1 million customers. It runs 100% of its data real time in a single cloud-based data-lake. Most important of all, it offers a great customer experience. The back-end (the core banking systems) are being migrated to our new, proprietary “Gravity” platform, moving us from mainframe technologies to more modern cloud environments. Gravity has already been tested in 4 markets with a plan to transition our core systems to our private cloud over the next 2 years.
We are now implementing the new model for consumer and commercial customers in the US, Spain and Mexico.
In the US, this transformation will enable significant operating leverage as we grow our deposits while creating top quartile customer experience. We are reducing products from around 300 to less than 20; and eliminating or automating more than 80% of the branch activities that are costly and add little value. These changes will significantly improve the efficiency of our US bank by lowering Non-Interest Expense / cost to serve by approximately 20% by 2025.
In the US, we are targeting specific market segments where we have local scale and can leverage the Group´s network. We are not pursuing a "universal" banking model. Through our focused strategy, Santander US is positioned to deliver profitable growth for shareholders by leveraging the Group’s strengths and initiatives across four key business lines: Auto, SCIB, Wealth Management and Commercial Real Estate. In Auto, we continue to increase gradually the use of deposit funding while improving the overall portfolio credit quality and digitizing the customer´s buying experience. In SCIB, we are enhancing our capabilities – such as securitizations, distribution, self-clearing - and leveraging the Group’s competitive advantage in Trade and Green Finance. Combined, all these businesses will allow Santander US to deliver 15% return on deployed capital through the cycle.
Last, we will continue to lock ESG into the frontline of our business. Having met our target to financially empower 10 million by 2025 three years early, we are setting a new target in financial inclusion: to provide access and finance to an additional 5 million people by 2025. Meanwhile, we will continue to progress towards our target of raising and facilitating €120 billion in green finance by 2025.
Less time spent on Operations in branches...
%Operational activity in branches
... with high level of automation
#Operational FTEs per Mn customers
We are executing One Transformation based on proven operating model and Tech
Scale
To achieve the best in-market profitability in each of our markets, we will further leverage our global scale and network businesses: SCIB, WM&I, Payments and Auto. And One Transformation will converge our consumer and commercial customers towards a common business and operating model, built on our own technology.
In the next 3 years, SCIB will further capitalize on its global coverage and leading global product factories – in Renewables, Project Finance, Export and Agency – to accelerate profitable growth in all three regions. Our goal is to grow revenues year over year by 27%, and our cross-border and collaboration revenues by c. 10% CAGR.
In the next 3 years, SCIB will further capitalize on its global coverage and leading global product factories – in Renewables, Project Finance, Export and Agency – to accelerate profitable growth in all three regions. Our goal is to grow revenues year over year by 27%, and our cross-border and collaboration revenues by c. 10% CAGR.
In WM&I, we will remain focused on being a top operator in our businesses, maintaining our strong share in all relevant markets. Our goal is to grow revenues at double-digit, and our private banking network AuM by c.10% CAGR.
On Payments, we expect our global platform, PagoNxt, to be processing more than 47 billion transactions in 2025, growing faster than the market rate. By concentrating payment assets and talent in PagoNxt, we benefit from a more efficient investment model (by building once as opposed to many times in different markets). The deployment of value-added services (lending, e-sellers and marketplaces) will help us accelerate our commercial activity both through our banks and in the open market, which will result in revenues growing at 30%. PagoNxt will be profitable from this year, 2023.
Finally, in Auto we will continue to leverage our global OEM relationships to expand the business across the three regions.
The unquestionable value our network businesses adds to the Group will be reflected in their contribution to our fee income, which will grow significantly.
These businesses, combined with our One Transformation plans, will help improve our operating performance: our cost to income ratio will fall from 45.8% to c.42% in 2025.
Operating performance improvement - Cost to income
Diversification
We will continue to benefit from higher rates in 2023 thanks to our diversification (in terms of both business and geography), coupled with the structure and positioning of our balance sheet. In 2022, we saw the positive impact of monetary policy primarily in the UK and the US. In 2023, we expect this to be the case in Europe. Approximately half of the net interest income expansion we expect in 2023 will come from our interest rate sensitivity in Europe. The other half will derive from new customers and a deeper relationship with our customer base. Under current market estimates, the positive impact of higher rates should extend at least into 2024.
The conservative risk profile and diversification of our businesses result in a through-the-cycle cost of risk of c.1.0%. This ratio is expected to be higher in 2023 as the cost of risk normalizes in the consumer portfolios in the US and Brazil. However, it is expected to gradually revert to the mean in the next few years.
We are confident of achieving our main financial targets, net interest and fee income growth, cost to income and cost of risk, in the current macroeconomic backdrop. Therefore, our profitability will increase further in 2023, after an already extraordinary 2022. Looking at the next three years, I am confident that our Return on Tangible Equity will stay within the 15-17% range while our capital remains above 12%, even taking into account the final implementation of Basel 3 in January 2025.
As I have mentioned, we manage the bank to generate sustainable value for all our stakeholders. This means that, for shareholders, we aim to beat our cost of capital. Our aim is to deliver “through-the-cycle” double digits average annual growth in Tangible Net Asset Value per share (TNAVps) + dividends per share (DPS). We are confident that staying at a return on tangible equity of 15-17% will enable us to reach this target over the next three years, while our FL CET1 capital measure remains at 12% or higher.
2015-2022
2023-2025
To ensure we deliver on our plan and achieve these very demanding financial metrics, we have defined relevant key performance indicators (KPIs) focused on customer productivity, efficiency and the contribution of our network.
2022
2025
TNAVps +
DPS growth
DPS growth
2023-2025
RoTE
0.0
13.4
%
0
15
-17%
Payout (Cash + SBB)1
0
40
%
0
50
%
EPS Growth
0
23
%
Double digit
1
Customer
centric
centric
Total customers
0
160
mn
c.
0
200
mn
Active customers2
0
99
mn
c.
0
125
mn
2
Simplification
& automation
& automation
Efficiency ratio
0.0
45.8
%
c.
0
42
%
3
Network
contribution
contribution
Global & network businesses contribution to total revenues
>
0
30
%
>
0
40
%
Global & network businesses contribution to total fees
c.
0
40
%
>
0
50
%
4
Customer
activity
activity
Transactions volume per active customer (#/month)3
0
27
c.
0
33
5
Capital
Fully loaded CET1
0.00
12.04
%
>
0
12
%
RWA with RoRWA > CoE
0
80
%
c.
0
85
%
ESG
Green finance raised & facilitated4
€
0.0
94.5
bn
€
0
120
bn
Socially responsible Investments (AuM)
€
0
53
bn
€
0
100
bn
People financially empowered5
>
0
10
mn
0
15
mn
Women in leadership positions
c.
0
29
%
0
35
%
Equal pay gap
c.
0
1
%
c.
0
0
%
1. Target payout will be c.50% of group reported profit (excluding non-cash, non-capital ratios impact items), distributed in approximately 50% in cash dividend and 50% in share buybacks. Execution of the shareholder remuneration policy is subject to future corporate and regulatory decisions and approvals.
2. Those customers who meet transactionality threshold in the past 90 days.
3. Includes merchant acquiring, cards and electronic A2A number of transactions.
4. Since 2019.
5. Since 2019. Additional 5mn people by 2025 with access and finance initiatives. Does not include financial education.
2. Those customers who meet transactionality threshold in the past 90 days.
3. Includes merchant acquiring, cards and electronic A2A number of transactions.
4. Since 2019.
5. Since 2019. Additional 5mn people by 2025 with access and finance initiatives. Does not include financial education.
Our plan will grow the business, in a way that creates value for our shareholders – in a prudent, responsible way.
We are committed to returning more of our profits to you, our shareholders. We will increase the payout1 ratio to c. 50% from 2023 onwards, through half cash dividends and half buybacks.
We are committed to returning more of our profits to you, our shareholders. We will increase the payout1 ratio to c. 50% from 2023 onwards, through half cash dividends and half buybacks.
1. Target payout will be c.50% of group reported profit (excluding non-cash, non-capital ratios impact items), distributed in approximately 50% in cash dividend and 50% in share buybacks. Execution of the shareholder remuneration policy is subject to future corporate and regulatory decisions and approvals.
Conclusion
As I look to the year ahead, the financial sector, like many others, is facing profound change. We have dealt with change successfully in the past, and we will do so again. Having a clear strategy and a sound plan, that leverage our strengths is paramount, as it is having the right team to make it happen.
Our customer focus, scale and diversification – together with our global brand and our team – means we have a unique place in the market. These attributes are very difficult for any competitor, existing or new, to copy; and they are increasingly valuable, especially in uncertain times.
We are focused on creating value for our shareholders in the right way, as we have done since 2015.
We will continue to deliver best-in-class operational performance and to meet on our financial targets. We remain focused on allocating our capital wisely, with c.85% of RWAs allocated to businesses returning greater than our cost of equity, and building tangible book value per share while making distributions to our shareholders through cash dividends and share buybacks with a total payout ratio of 50%. Building on our progress, I am confident that our 3-year plan will deliver a RoTE of 15 - 17% with a CET1 ratio at or above 12%. And a double-digit average annual growth in TNAVps and DPS through the cycle.
Our people, culture and governance will continue to be key. We will continue building a diverse team in terms of background and gender: our target by 2025 is to increase the percentage of women in senior positions to 35% - and strengthen our talent by further promoting internal mobility.
Grounded on our strong-skilled, expert, independent, and diverse board, our robust governance will ensure we implement our strategy while controlling risks and meeting our stakeholders’ expectations.
We are embarking on a new phase at Banco Santander with our new CEO, Héctor Grisi. With his impressive career and deep understanding of Santander, we have great confidence that he will accelerate the Group's transformation. To do that, he and I will continue to work closely together - just as José Antonio Álvarez and I have done.
I am extremely grateful to José Antonio for his hard work and many contributions to the Group over the last 20 years. It has been a privilege working with him and I am delighted that he will remain on our Board of Directors as Non-executive Vice Chair.
I would also like to thank Marty Chavez and Sergio Rial for their dedication to the Board, and welcome Glenn Hutchins and Germán de la Fuente who bring key experience.
To all of them; to our nearly 200,000 colleagues across the world; to our 160 million customers; and to you, our shareholders: thank you, each of you, for your support and trust.
“We are focused on creating value for our shareholders in the right way, as we have done since 2015”
Ana Botín
Executive Chair
Santander
02. Chief Executive Officer's Letter
Next